100% free Certificate included Downloadable templates

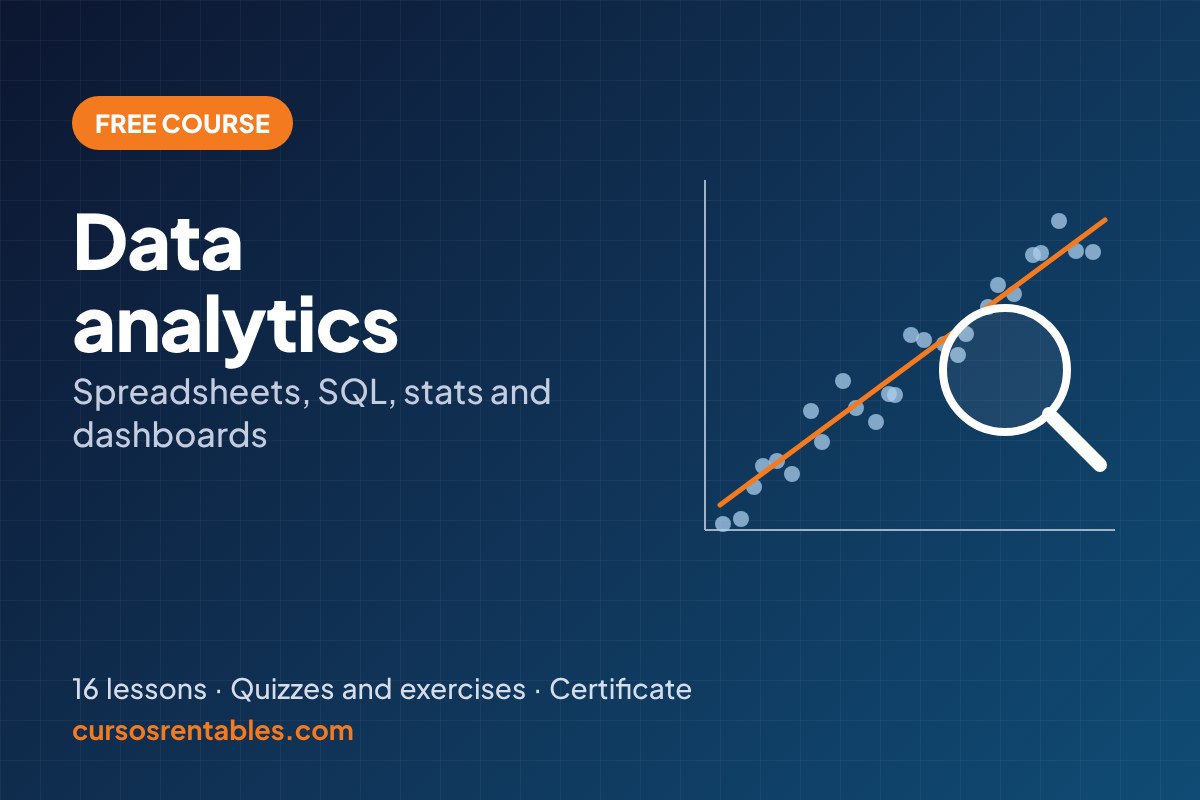
Free Data Analytics Course

Learn to clean, analyze and present data with Excel, Google Sheets, SQL, Power BI, Looker Studio and Python, using one realistic sales dataset from your first formula to a portfolio project.

  • 16lessons
  • 3h 23minof reading
  • 64review questions
  • 16worked exercises

No sign-up needed: just start reading. Create a free account to save your progress and get your certificate.

What you’ll learn

  • Explain what data analytics is and what a data analyst does
  • Follow the six-phase analysis process from question to decision
  • Classify data types and structure tidy, analysis-ready tables
  • Analyze data in Excel and Google Sheets with SUMIFS, COUNTIFS and XLOOKUP
  • Clean raw data: duplicates, missing values, inconsistent text and dates
  • Calculate and interpret mean, median, standard deviation and percentiles
  • Summarize data quickly with pivot tables and % of total
  • Write SQL queries with SELECT, WHERE, ORDER BY and LIMIT
  • Aggregate and combine tables with GROUP BY, HAVING and JOINs
  • Choose the right chart and write titles that state the takeaway
  • Build dashboards in Power BI and Looker Studio
  • Present findings with data storytelling
  • Interpret correlation, trends and A/B test results without confusing correlation and causation
  • Clean, analyze and chart data in Python with pandas
  • Complete an end-to-end portfolio project
  • Write a data analyst résumé and prepare for SQL and behavioral interviews
A clear goal

Every lesson starts by telling you what you’ll be able to do.

Real examples

Real-life cases from U.S. households and small businesses.

Instant quizzes

Check what you learned with immediate feedback.

Worked exercise

Practice first, then compare with the solution.

Course syllabus

4 levels · 16 lessons · 3h 23min of content

1 Level 1Beginner 4 lessons · 52 min
  1. 1
    What Is Data Analytics and What Does a Data Analyst Do?

    The four types of analytics, a data analyst's day, analyst vs. data scientist vs. engineer, the core toolkit and BLS career data.

    14 min
  2. 2
    The Data Analysis Process in 6 Phases

    Ask, prepare, process, analyze, share and act, applied step by step to a real question about a December sales spike.

    14 min
  3. 3
    Types of Data and How to Structure a Table

    Categorical vs. numerical data, data types in Excel, SQL and pandas, tidy data, wide vs. long tables and data dictionaries.

    13 min
  4. 4
    Excel and Google Sheets for Data Analysis

    Tables, filters, SUMIFS, COUNTIFS, AVERAGEIFS, XLOOKUP, UNIQUE and FILTER, conditional formatting and Excel vs. Google Sheets.

    11 min
2 Level 2Intermediate 4 lessons · 50 min
  1. 5
    Data Cleaning: Duplicates, Errors and Missing Values

    Profile a raw file, remove duplicates, handle blanks, fix inconsistent text and dates, validate totals and keep a cleaning log.

    13 min
  2. 6
    Descriptive Statistics: Mean, Median, Standard Deviation and Percentiles

    Mean vs. median, skewed data, standard deviation, quartiles, IQR outliers and percentiles, with Excel formulas.

    13 min
  3. 7
    Pivot Tables for Data Analysis

    Build pivot tables in Excel and Google Sheets, cross-tabs, % of total, date grouping, slicers and common pivot mistakes.

    11 min
  4. 8
    Introduction to SQL: SELECT, WHERE and ORDER BY

    Set up SQLite, import the practice data and write queries with filters, sorting, LIMIT, DISTINCT, IN, LIKE and calculated columns.

    13 min
3 Level 3Advanced 4 lessons · 47 min
  1. 9
    Intermediate SQL: GROUP BY, HAVING and JOINs

    Aggregate functions, GROUP BY, WHERE vs. HAVING, query execution order, INNER and LEFT JOINs and gross profit by category.

    12 min
  2. 10
    Data Visualization: How to Choose the Right Chart

    Match the chart to the question, design rules for bar and line charts, color, takeaway titles and chart mistakes to avoid.

    11 min
  3. 11
    Dashboards with Power BI and Looker Studio

    KPIs and layout, step-by-step builds in Power BI (with DAX measures) and Looker Studio, filters, sharing and a design checklist.

    12 min
  4. 12
    Data Storytelling: Presenting Your Findings

    The big idea, what / so what / now what, headline titles, audience, a five-slide storyline and honest presentation of uncertainty.

    12 min
4 Level 4Expert 4 lessons · 53 min
  1. 13
    Correlation, Trends and A/B Testing

    Pearson correlation, why correlation is not causation, confounders, trend lines, moving averages and how to read an A/B test.

    14 min
  2. 14
    Python for Data Analysis with pandas

    Load, clean, group, pivot, merge and chart the practice data with tested pandas code in Google Colab or Jupyter.

    11 min
  3. 15
    Portfolio Project: Analyze a Business End to End

    A complete year-end sales review: questions, cleaning log, analysis, dashboard, recommendations, README and a grading rubric.

    14 min
  4. 16
    How to Get Your First Data Analyst Job

    Job titles, portfolio, résumé bullets that show results, LinkedIn, interview stages, SQL and STAR questions and a 90-day plan.

    14 min

About this course

A practical data analytics course for beginners who want to think and work like a data analyst. Instead of toy examples, every lesson uses the same realistic dataset: 200 orders from a fictional U.S. retailer in 2025, with regions, states, products, channels and revenue in U.S. dollars. You start with the analysis process and the types of data, and by the end you have a complete project you can show to employers.

You'll learn to work in Excel and Google Sheets (SUMIFS, XLOOKUP, pivot tables), clean messy data (duplicates, blanks, inconsistent text and dates), calculate descriptive statistics, write SQL queries with GROUP BY, HAVING and JOINs, choose the right chart, build dashboards in Power BI and Looker Studio, present findings with data storytelling, read correlations and A/B tests, and repeat the whole workflow in Python with pandas. The final lessons walk you through a portfolio project and the steps to land your first data analyst job: résumé, portfolio and interviews. There are 16 lessons in four levels, with interactive quizzes and exercises with solutions, and every number in the lessons is calculated from the practice file.

Includes downloadable resources: a sales practice workbook (.xlsx) with raw data containing deliberate errors, a cleaned answer key, a product table for lookups and JOINs, a summary sheet with ready-made formulas and a data dictionary, plus CSV versions for SQL and Python.

Downloadable resources

Templates and practice data you’ll use throughout the course. Free, no sign-up.

  • CSV sales-practice-data-clean.csv15 KB Download
  • CSV sales-practice-data.csv16 KB Download
  • XLS sales-practice-data.xlsx32 KB Download
  • CSV sales-practice-products.csv1 KB Download

Frequently asked questions

Is this data analytics course really free?
Yes. All 16 lessons and the practice dataset are free, and you can read them without signing up. With a free account you can save your progress and download a certificate of completion when you finish.
Do I need any experience with math, coding or Excel?
No. The course starts from zero. You only need basic arithmetic and percentages. Spreadsheet formulas, SQL and Python are introduced step by step, with every example worked out on the same dataset.
What software do I need?
Excel or Google Sheets (free) for the first lessons, a free SQL tool such as DB Browser for SQLite, Power BI Desktop (free for Windows) or Looker Studio (free in any browser) for dashboards, and Google Colab or Jupyter for Python. No paid tools are required.
Will this course get me a data analyst job?
No course can guarantee a job, but this one gives you the core skills employers list most often for entry-level analyst roles and a complete portfolio project to show them. The last lesson covers your résumé, portfolio, LinkedIn profile and interview preparation.
Is the practice dataset real?
It's fictional but realistic: 200 orders from a U.S. retailer in 2025, with outliers, seasonality and deliberate errors (duplicates, blanks, inconsistent state names and a mis-formatted date) so you can practice real-world cleaning. A cleaned answer key is included.