Lesson 14 of 16 · Level 4: Expert
Python Charts with matplotlib: Bar Charts, Line Charts and a Report Dashboard
- ⏱ 13 min read
- ❓ 4 review questions
- ✍️ Exercise with solution
- 📥 Downloadable template
In this lesson
- Create bar charts, line charts and stacked bar charts with matplotlib.
- Plot straight from pandas with
.plot(). - Build a dashboard of several charts and save it as an image for a report.
- Choose the right chart and avoid the mistakes that mislead readers.
- Use a scatter plot to uncover relationships in a small business's data.
The examples use the coffee roaster's sales from lessons 11 and 13; the exercise uses the expense tracker data from lesson 8.
- sales.csv · Q1 2026 sales by region, rep and product
- expenses.csv · 40 sample household expenses
A table of numbers answers questions for anyone with time to read it. A good chart answers them in two seconds. In this lesson you'll turn the sales analysis from lessons 11 and 13 into a visual dashboard with matplotlib, Python's most widely used charting library and the foundation many others are built on.
Which chart do you need?
Before writing code, decide which question you're answering. Almost every business chart falls into one of these four:
Line · ax.plot
How does it change over time? Sales by month, a daily exchange rate.
Bar · ax.barh
Which is biggest? Sales by region, product or rep, sorted.
Stacked bar
What makes up the total? Each month's sales broken down by product.
Scatter · ax.scatter
Is one thing related to another? Temperature and sales, price and units.
Setup and your first chart
pip install matplotlib pandas(Activate your virtual environment first, as in lesson 10.) The basic matplotlib pattern never changes: create a figure with one or more "axes" (each axes is one chart), draw, then save or show it.
import matplotlib.pyplot as plt

months = ["Jan", "Feb", "Mar"]
sales = [3887.5, 2525.0, 3765.0]

fig, ax = plt.subplots(figsize=(7, 4))   # size in inches
ax.plot(months, sales, marker="o")
ax.set_title("Sales by month")
ax.set_ylabel("Revenue ($)")
fig.savefig("sales_by_month.png", dpi=150)   # save the image
plt.show()                                   # open a window (Jupyter shows it automatically)
Always work with fig and ax (the "object-oriented interface"). You'll see code online that calls plt.plot() directly: it works for quick charts but gets messy as soon as you want more than one.
Preparing the data with pandas
We start from the sales file. As you know from lesson 11, one row has no region; it belongs to Maria, who covers the Midwest:
import pandas as pd

df = pd.read_csv("sales.csv", parse_dates=["date"])
df["region"] = df["region"].fillna("Midwest")
df["revenue"] = df["units"] * df["price"]

by_region = df.groupby("region")["revenue"].sum().sort_values()
print(by_region)
region
East 2707.5
Midwest 2870.0
West 4600.0
Name: revenue, dtype: float64Bar charts: comparing categories
fig, ax = plt.subplots(figsize=(7, 4))
ax.barh(by_region.index, by_region.values, color="#2f6fed")
ax.set_title("West leads Q1 2026 sales")
ax.set_xlabel("Revenue ($)")

for i, v in enumerate(by_region.values):          # label each bar with its value
    ax.text(v, i, f" ${v:,.0f}", va="center")

ax.spines[["top", "right"]].set_visible(False)     # remove unnecessary borders
fig.tight_layout()
fig.savefig("sales_by_region.png", dpi=150)
Three decisions make this chart easier to read: horizontal bars (long names fit without rotating them), bars sorted from smallest to largest (with sort_values(), the biggest ends up on top) and the value written next to each bar, so nobody has to estimate it from the axis.
1. You want to show how sales changed month to month. Which chart do you use?
Lines show trends over time. Bars compare categories, and pie charts only work for a few parts of a whole.
Plotting straight from pandas
DataFrames and Series have a .plot() method that uses matplotlib under the hood. It's ideal for pivot tables:
months = {1: "Jan", 2: "Feb", 3: "Mar"}

by_product = df.pivot_table(index=df["date"].dt.month, columns="product",
                            values="revenue", aggfunc="sum", fill_value=0)
by_product.index = by_product.index.map(months)
print(by_product)

ax = by_product.plot(kind="bar", stacked=True, rot=0, figsize=(7, 4))
ax.set_title("Sales by product and month")
product Chocolate Coffee Tea
date
Jan 0.0 3080.0 807.5
Feb 640.0 840.0 1045.0
Mar 880.0 2030.0 855.0kind accepts "line", "bar", "barh", "hist", "box", "scatter" and more. The dictionary gives us short, predictable month labels that don't depend on your computer's language settings.
A dashboard with several charts
With plt.subplots(1, 3) you get three axes in a row and fill them one by one:
months = {1: "Jan", 2: "Feb", 3: "Mar"}
by_month = df.groupby(df["date"].dt.month)["revenue"].sum()
by_month.index = by_month.index.map(months)

fig, axs = plt.subplots(1, 3, figsize=(15, 4.5))

axs[0].plot(by_month.index, by_month.values, marker="o", linewidth=2)
axs[0].set_title("Sales by month")
axs[0].set_ylim(bottom=0)

by_product.plot(kind="bar", stacked=True, ax=axs[1], rot=0)
axs[1].set_title("Sales by product")
axs[1].set_xlabel("")
axs[1].legend(title="", frameon=False)

axs[2].barh(by_region.index, by_region.values, color="#2f6fed")
axs[2].set_title("Sales by region")

for ax in axs:
    ax.spines[["top", "right"]].set_visible(False)

fig.suptitle("Sales dashboard · Q1 2026", fontsize=14, fontweight="bold")
fig.tight_layout()
fig.savefig("sales_dashboard.png", dpi=150)
The result:
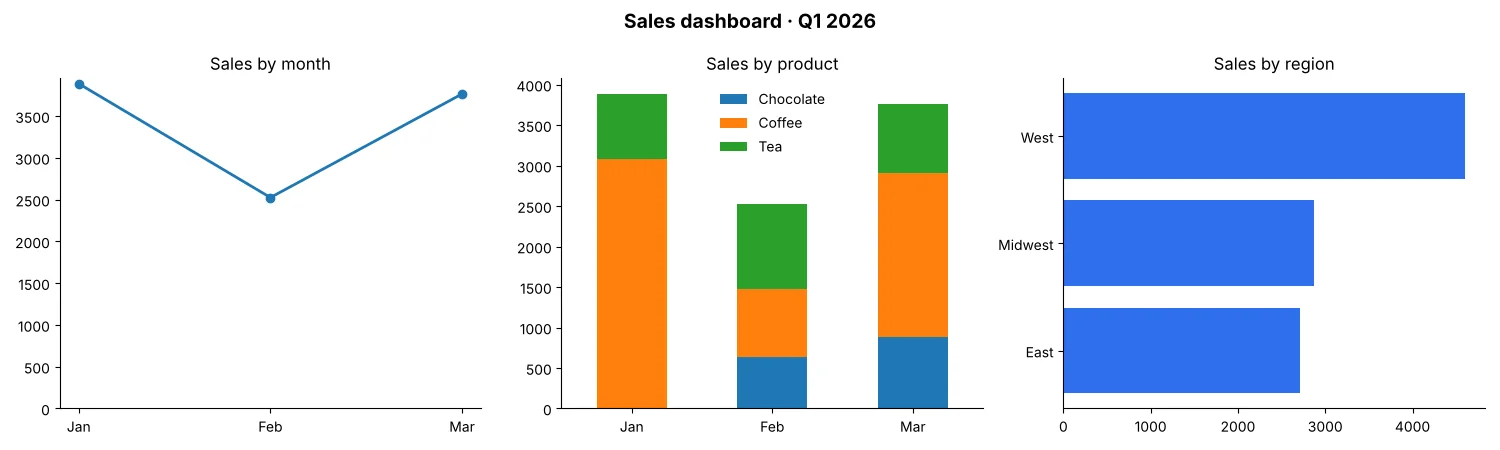
The two-second read: February was the weak month (mostly because coffee dropped from $3,080 to $840), chocolate starts selling in February, and the West alone brings in 45.2% of the quarter's $10,177.50. That's exactly what a good dashboard should deliver.
Use dpi=150 or more for documents and slides, format="svg" for a vector chart that stays sharp at any size, and bbox_inches="tight" if a title gets cut off. Combine it with lesson 12 and you can generate this dashboard every Monday and email it without touching anything.
Charts that don't mislead
Bars with the axis starting at 2,000.
Bars start at zero: otherwise a 5% difference looks like 200%.
Generic titles like "Sales."
One message per chart, stated in the title: "February sales fell 35%."
Pie charts with 6 or 8 slices.
Beyond 3 or 4 parts, bars are far easier to compare.
A different color for every bar "because it looks nice."
Few colors, used on purpose: one neutral color for everything and one strong color for what you want to highlight.
3D effects.
No 3D: it distorts proportions and adds no information.
2. In a bar chart, the y-axis starts at 2,500, and the February bar ($2,525) looks about 50 times shorter than March ($3,765). What do you fix?
In a bar chart, length represents the value. If the axis doesn't start at zero, the proportions lie: here March is really about 1.5 times February, not 50 times.
3. What does fig, axs = plt.subplots(2, 2) give you?
subplots(rows, columns) returns the figure and a grid of axes. With a single row, (1, 3), you use one index: axs[0], axs[1]…
Real case: does heat sell ice cream?
The owner of an ice cream shop in Myrtle Beach, South Carolina, suspects she sells more on hot days and wants to decide how much mix to prepare based on the forecast. For 10 days she wrote down the high temperature and the cones sold. To see whether two numeric variables are related, the right chart is a scatter plot: one dot per day.
import matplotlib.pyplot as plt
import pandas as pd

# Ice cream shop in Myrtle Beach, SC: high temperature and cones sold over 10 days
data = pd.DataFrame({
    "temperature": [76, 79, 80, 82, 84, 86, 88, 90, 92, 94],
    "cones":       [118, 135, 150, 149, 170, 182, 190, 214, 220, 241],
})
r = data["temperature"].corr(data["cones"])
hot = data[data["temperature"] > 86]["cones"].mean()
mild = data[data["temperature"] <= 86]["cones"].mean()
print(f"Correlation: {r:.2f}")
print(f"Average above 86°F: {hot:.0f} cones")
print(f"Average at 86°F or below: {mild:.0f} cones")

fig, ax = plt.subplots(figsize=(6, 4))
ax.scatter(data["temperature"], data["cones"], color="#2459d6", s=60)
ax.set_title(f"Hotter days, more ice cream (correlation {r:.2f})")
ax.set_xlabel("High temperature (°F)")
ax.set_ylabel("Cones sold")
ax.set_ylim(bottom=0)
ax.spines[["top", "right"]].set_visible(False)
fig.tight_layout()
fig.savefig("heat_ice_cream.png", dpi=150)
Correlation: 0.99
Average above 86°F: 216 cones
Average at 86°F or below: 151 cones- One day of sales 10 daysEach dot: temperature (x-axis) and cones sold (y-axis).
- Best day 241At 94°F, the hottest day.
Correlation runs from −1 to 1: near 1, the two variables rise together; near 0, there's no linear relationship. The practical takeaway is clear: days above 86°F sell an average of 216 cones versus 151, about 65 more. But careful: correlation isn't causation. If those hot days were also weekends or the Fourth of July, part of the jump could come from that. In lesson 16 you'll see how a model learns relationships like this to make predictions.
4. You want to see whether a product's price is related to the units you sell each week. Which chart do you use?
A scatter plot shows the relationship between two numeric variables: each dot is one week. If the dots fall from left to right, higher prices mean fewer sales.
Common matplotlib errors
The most frequent error appears when two lists aren't the same length, for example three months and four values:
ValueError: x and y must have same first dimension, but have shapes (3,) and (4,)The "shapes" (3,) and (4,) are the lengths of each list: a month is missing or there's an extra value. Other common stumbles:
Calling plt.savefig() after plt.show(): the image comes out blank.
Once the window closes, the figure is no longer "current." Save first, or use fig.savefig().
Creating charts in a loop (one per store) and seeing More than 20 figures have been opened.
Close each figure with plt.close(fig) after saving it.
Overlapping labels on the x-axis.
Rotate them with ax.tick_params(axis="x", rotation=45) or switch to horizontal bars.
Practice exercise: your expense dashboard
Using expenses.csv (columns date, category, description, amount) from lesson 8's project:
- Calculate total spending by category and show it as sorted horizontal bars, with the value on each bar.
- Calculate spending by month and show it as a line with the axis starting at zero.
- Put both charts in a 1 × 2 figure and save it as
expense_dashboard.png.
See solution
import matplotlib.pyplot as plt
import pandas as pd

e = pd.read_csv("expenses.csv", parse_dates=["date"])
by_cat = e.groupby("category")["amount"].sum().sort_values()
by_month = e.groupby(e["date"].dt.to_period("M"))["amount"].sum()
by_month.index = by_month.index.astype(str)       # "2026-09", "2026-10"…

fig, axs = plt.subplots(1, 2, figsize=(12, 4))

axs[0].barh(by_cat.index, by_cat.values, color="#2f6fed")
for i, v in enumerate(by_cat.values):
    axs[0].text(v, i, f" ${v:,.0f}", va="center")
axs[0].set_title("Food is 42% of spending")

axs[1].plot(by_month.index, by_month.values, marker="o")
axs[1].set_ylim(bottom=0)
axs[1].set_title("Spending by month")

for ax in axs:
    ax.spines[["top", "right"]].set_visible(False)

fig.tight_layout()
fig.savefig("expense_dashboard.png", dpi=150)
The bars read transportation $291, entertainment $312, housing $404 and food $739; the line rises from $795.05 in September to $952.03 in October. If your dates span many months and the labels overlap, add axs[1].tick_params(axis="x", rotation=45).
Summary
- The basic pattern:
fig, ax = plt.subplots(), draw onax, thenfig.savefig(). - Lines for time, sorted bars to compare categories, stacked bars for composition, scatter plots for relationships.
- pandas plots directly with
.plot(kind=...), and you can combine both styles by passingax=. - A dashboard is one figure with several axes:
plt.subplots(rows, columns). - Bars start at zero, one message per chart, few colors and no 3D.
Next lesson: Web Scraping with Python: requests and BeautifulSoup Step by Step. You'll collect data that doesn't come in any file by extracting it from web pages, responsibly.
Create your account in 30 seconds, mark your lessons and download your certificate at the end.