100% free Certificate included Downloadable templates

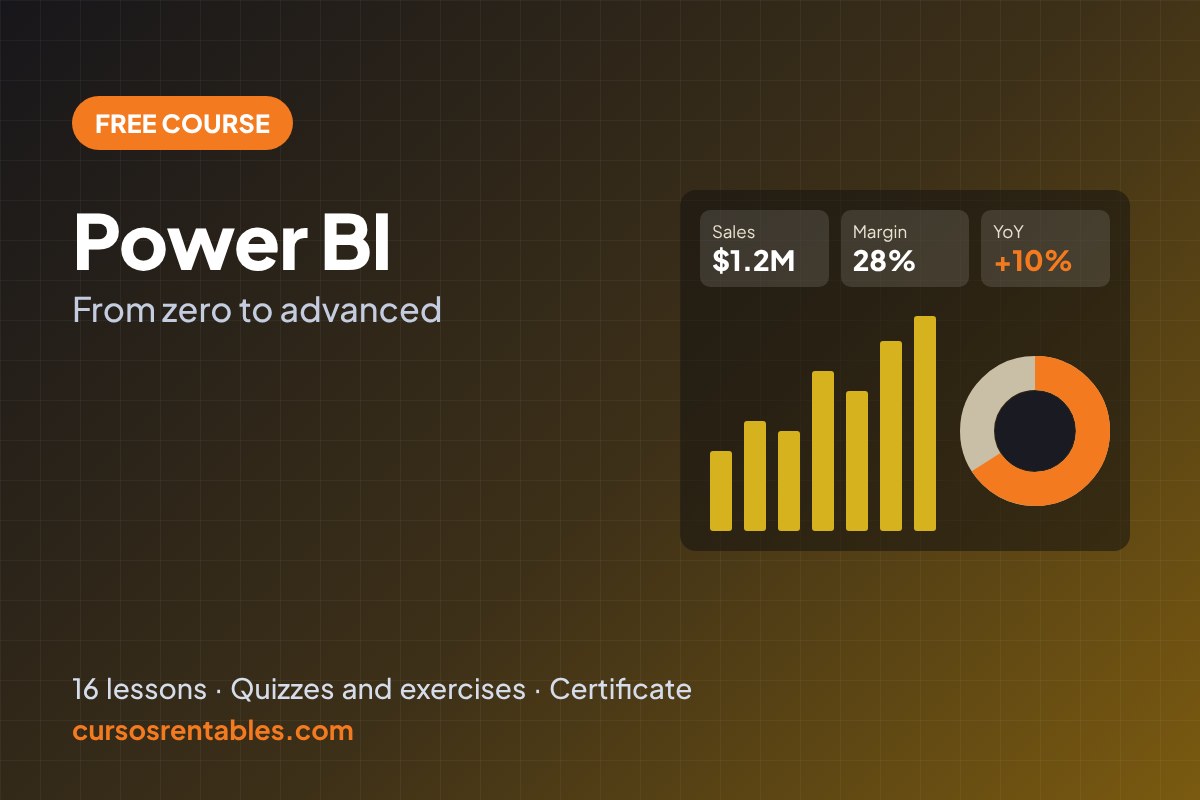
Free Power BI Course: From Beginner to Advanced

Learn to build professional Power BI reports and dashboards step by step: Power Query, star schema data models, DAX, time intelligence, interactive reports, publishing with row-level security, a P&L statement, ABC and RFM analysis, and PL-300 exam prep.

  • 16lessons
  • 3h 26minof reading
  • 64review questions
  • 16worked exercises

No sign-up needed: just start reading. Create a free account to save your progress and get your certificate.

What you’ll learn

  • Install Power BI Desktop and build your first report
  • Clean and transform data with Power Query, including unpivoting and merging
  • Choose the right visual and use filters, slicers and interactions
  • Design clear reports with themes, navigation and a mobile layout
  • Build a star schema with one-to-many relationships
  • Write DAX measures with SUM, SUMX, COUNTROWS, DISTINCTCOUNT and DIVIDE
  • Master CALCULATE, ALL, REMOVEFILTERS, ALLSELECTED and FILTER
  • Create a date table and YTD, prior-year and moving-average measures
  • Add drillthrough, report page tooltips, bookmarks and field parameters
  • Publish, schedule refresh and apply static and dynamic row-level security
  • Build rankings, Top N, customer segments and new-customer measures
  • Build a complete sales dashboard for your portfolio
  • Build an income statement (P&L) with DAX and a break-even measure
  • Connect to SQL databases and choose between Import and DirectQuery
  • Run ABC (Pareto) and RFM customer segmentation
  • Prepare for the Microsoft PL-300 Power BI Data Analyst exam
A clear goal

Every lesson starts by telling you what you’ll be able to do.

Real examples

Real-life cases from U.S. households and small businesses.

Instant quizzes

Check what you learned with immediate feedback.

Worked exercise

Practice first, then compare with the solution.

Course syllabus

4 levels · 16 lessons · 3h 26min of content

1 Level 1Beginner 4 lessons · 51 min
  1. 1
    What Is Power BI? What It's Used For and Your First Report

    Power BI vs. Excel, Desktop vs. the Power BI service, installation, the main views and a first report in 15 minutes.

    14 min
  2. 2
    Power Query in Power BI: How to Clean and Transform Data

    Connectors, the Power Query Editor, cleanup steps, data types, unpivot, append, merge, folders and data profiling.

    13 min
  3. 3
    Power BI Visuals, Filters and Slicers

    Which chart to use, cards, bar and line charts, matrices, filter levels, slicers, visual interactions and formatting.

    12 min
  4. 4
    How to Design a Professional Power BI Report

    Planning with the user, page structure, layout, themes, navigation, mobile layout and a pre-launch checklist.

    12 min
2 Level 2Intermediate 4 lessons · 50 min
  1. 5
    Data Modeling and Relationships: The Star Schema

    Fact and dimension tables, one-to-many relationships, filter direction, different grains and common model problems.

    12 min
  2. 6
    DAX for Beginners: Measures and Calculated Columns

    Measures vs. calculated columns, SUM, COUNTROWS, DISTINCTCOUNT, DIVIDE, SUMX, RELATED and filter context.

    12 min
  3. 7
    CALCULATE and Filter Context in DAX

    CALCULATE, KEEPFILTERS, ALL, REMOVEFILTERS, ALLSELECTED, FILTER and context transition.

    13 min
  4. 8
    Date Tables and Time Intelligence: YTD, Prior Year and Growth

    A DAX calendar table, TOTALYTD, SAMEPERIODLASTYEAR, DATEADD, moving averages and partial periods.

    13 min
3 Level 3Advanced 4 lessons · 51 min
  1. 9
    Interactive Reports: Drillthrough, Tooltips, Bookmarks and Parameters

    Hierarchies, drillthrough pages, report page tooltips, bookmarks, field and numeric parameters, dynamic titles.

    13 min
  2. 10
    Publishing and Sharing in the Power BI Service with Row-Level Security

    Licenses, workspaces, scheduled refresh, gateways, apps, subscriptions and static and dynamic RLS.

    13 min
  3. 11
    Advanced DAX and Performance: Variables, Rankings, Top N and New Customers

    VAR and RETURN, RANKX, TOPN, SWITCH(TRUE()), new and lost customers, USERELATIONSHIP and Performance analyzer.

    12 min
  4. 12
    Final Project: Build a Complete Sales Dashboard in Power BI

    Data, Power Query, model, 20+ measures, interactive pages, security, validation, publishing and your portfolio.

    13 min
4 Level 4Expert 4 lessons · 54 min
  1. 13
    Income Statement (P&L) in Power BI with DAX

    A layout table, an expenses table, a SWITCH measure, subtotals, percent of sales, break-even and financial formatting.

    13 min
  2. 14
    Import vs. DirectQuery, Gateways and Scheduled Refresh in Power BI

    Connecting to SQL databases, storage modes, query folding, the on-premises data gateway, scheduled and incremental refresh.

    13 min
  3. 15
    ABC (Pareto) Analysis and RFM Customer Segmentation in Power BI

    Cumulative percentage in DAX, ABC classes as a measure and a column, a Pareto chart, and champion and at-risk customers with RFM.

    14 min
  4. 16
    Power BI PL-300 Certification: Exam Topics, Study Plan and Portfolio

    What the PL-300 exam measures, a six-week study plan, a portfolio that gets interviews and common data analyst interview questions.

    14 min

About this course

Learn Power BI, one of the most requested tools in U.S. job postings for data analysts, financial analysts, sales operations and business intelligence roles, from zero and with a real project. You'll build the sales dashboard of Summit Supply Co., a fictional U.S. food and beverage distributor, with verified numbers, interactive quizzes and a worked exercise in every lesson. If you already know Excel, this is the natural next step.

Across 16 lessons in four levels you'll go from your first report to the skills that separate a casual user from a professional: cleaning data with Power Query, building a star schema, writing DAX measures, mastering CALCULATE and filter context, time intelligence (YTD, prior year, moving averages), interactive reports with drillthrough and bookmarks, publishing to the Power BI service, row-level security and performance tuning. The Expert level covers an income statement (P&L) built with DAX, connecting to SQL databases with scheduled and incremental refresh, ABC (Pareto) and RFM analysis, and a study plan for the Microsoft PL-300 certification.

Includes a free downloadable dataset: the complete Summit Supply database in Excel (4,430 order lines, products, customers, sales reps and monthly targets in dollars) for every lesson and the final project.
Downloadable resources

Templates and practice data you’ll use throughout the course. Free, no sign-up.

  • XLS summit-sales-power-bi.xlsx160 KB Download

Frequently asked questions

Do I need to know Excel to take this Power BI course?
It helps, but it isn't required. The course explains everything from scratch. If you want to strengthen the basics first, our free Data Analytics course covers Excel and Google Sheets for analysis, pivot tables and data cleaning.
Is Power BI free?
Power BI Desktop, the app you use to build reports, is free for Windows. Sharing reports in the Power BI service usually requires a paid license (Pro or Premium Per User) or content hosted on a company capacity. Lesson 10 explains the options; check Microsoft's pricing page for current terms.
Can I take the course on a Mac?
Power BI Desktop only runs on Windows. On a Mac you can use a Windows virtual machine, a cloud PC or remote desktop, or the Power BI service in your browser for basic tasks. For the full course, Windows is the easiest option.
Is this Power BI course really free, and do I get a certificate?
Yes. All 16 lessons are free and public. With a free account you can track your progress, mark lessons as completed and download a certificate of completion when you finish.
Does the course prepare me for the PL-300 exam?
Yes. It covers most of the PL-300 skills (prepare, model, visualize and analyze data, and manage and secure Power BI). The last lesson maps each exam area to the lessons, lists the topics to review on Microsoft Learn and gives you a six-week study plan.