How to Become a Data Analyst: A 7-Step Roadmap
In this article
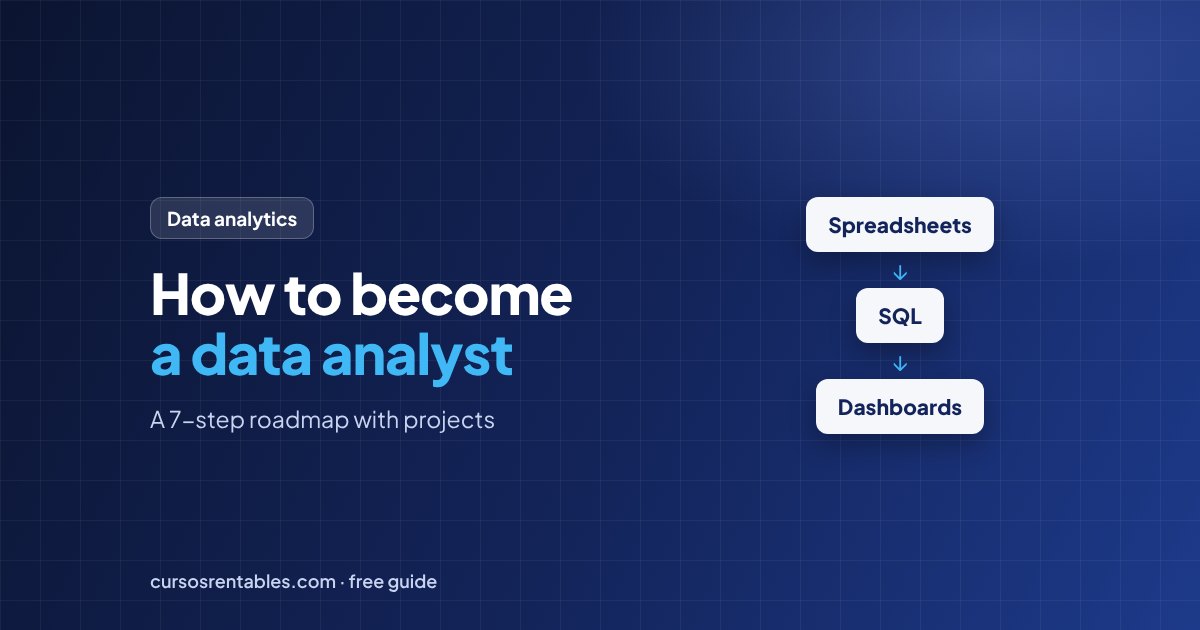
To become a data analyst, learn four core skills in this order: spreadsheets (Excel or Google Sheets), SQL, one dashboard tool such as Power BI or Tableau, and basic statistics. Then prove those skills with two or three portfolio projects that answer real business questions, and apply for entry-level analyst roles with a résumé that shows results, not just tools. You don't need a computer science degree or advanced math. For a beginner studying part-time, a realistic plan is about 6 to 9 months of learning, plus the job search.
This guide breaks the path into seven steps, shows which tools to learn first (and which can wait), gives you five portfolio project ideas and explains when a certification is worth your time.
What does a data analyst actually do?
A data analyst turns raw data into answers a business can act on. A typical week might include pulling last month's orders with SQL, cleaning a messy export from a sales system, updating a dashboard and explaining to a manager why returns jumped in one region. The questions are practical: Which products are growing? Where are we losing customers? Did the spring promotion actually work?
The role is often confused with two neighbors. Here's how they differ:
| Role | Main question | Typical tools | Math you need |
|---|---|---|---|
| Data analyst | What happened, and why? | Excel, SQL, Power BI or Tableau, some Python | Descriptive statistics, percentages, basic testing |
| Data scientist | What will happen next? | Python or R, machine learning libraries, SQL | Statistics, probability and modeling |
| Data engineer | Is the data reliable and available? | SQL, Python, cloud data warehouses, pipelines | Less statistics, more software engineering |
Analyst work is a natural entry point into the data field because the core tools can be learned in months, not years. For a closer look at an analyst's day and the four types of analytics, read the first lesson of our free course, What Is Data Analytics and What Does a Data Analyst Do?
The skills you need
Job postings can look intimidating, with long lists of tools. In practice, entry-level analysts are hired for a short list of skills done well:
Spreadsheets
Excel or Google Sheets: conditional formulas, lookups, pivot tables, charts and basic cleaning.
Learn first: SUMIFS, COUNTIFS, XLOOKUP and pivot tables.SQL
The language analysts use to pull data out of company databases: filter, group, join and summarize.
Learn first: SELECT, WHERE, GROUP BY, HAVING and JOINs.Visualization and BI
Choosing the right chart and building a dashboard in Power BI, Tableau or Looker Studio.
Learn first: bar and line charts with titles that state the takeaway.Basic statistics
Mean vs. median, spread, percentiles, outliers, correlation and how to read an A/B test.
Learn first: when the median tells a truer story than the average.Communication
Turning numbers into a clear recommendation for people who don't care about formulas.
Learn first: lead with the answer, then show the evidence.Python (later)
pandas for larger files, repeatable cleaning and automation. Useful, but rarely the first thing an entry-level role tests.
Learn it: after SQL and your first project.The skills nobody lists, but everybody notices
Curiosity (asking "why?" one more time), business sense (knowing which number matters to the person in front of you) and healthy skepticism toward your own results. Good analysts check whether totals add up before they share a chart. That habit alone prevents the most embarrassing mistakes in the job.
Which tools to learn first
Pick one tool per category and go deep. The concepts transfer: if you know one SQL dialect or one BI tool well, switching to another takes weeks, not months.
| Tool | What you use it for | Priority | When to learn it |
|---|---|---|---|
| Excel or Google Sheets | Quick analysis, cleaning, pivot tables, ad hoc reports | Must-have | First |
| SQL (PostgreSQL, MySQL, SQLite, BigQuery…) | Querying and combining tables in databases | Must-have | Second |
| Power BI, Tableau or Looker Studio | Dashboards and recurring reports | Must-have (pick one) | Third |
| Python with pandas | Large files, automation, advanced analysis | Nice to have | After your first project |
| Git and GitHub | Publishing and versioning your portfolio | Nice to have | When you publish projects |
Not sure which BI tool to choose? Search job postings in your city or target industry and count which one appears more often. That's your answer.
The 7-step roadmap to become a data analyst
Step 1: Learn how analysis works
Before any tool, learn the process: ask a clear question, prepare the data, process (clean) it, analyze it, share the findings and help the business act on them. Beginners often start with the data and look for something interesting. Analysts start with a decision someone needs to make. "Show me the sales data" is a request; "Should we keep running free shipping in the Midwest?" is a question you can answer.
Step 2: Get strong in spreadsheets
Spreadsheets teach you analytical thinking with instant feedback: you change a filter and see the result. Aim to be comfortable with conditional formulas, lookups, pivot tables, charts and cleaning tasks like removing duplicates and fixing inconsistent text. Our guide to Excel formulas for data analysis covers the 18 formulas you'll use most, each with a worked example.
Step 3: Learn SQL
Much of a company's data lives in databases, and SQL is how you get it out. Start with SELECT, WHERE and ORDER BY, then move to GROUP BY, HAVING and JOIN. Practice daily, even for 20 minutes: SQL is a skill you build by writing queries, not by watching videos. You can practice for free with SQLite on your own computer, as we do in Introduction to SQL: SELECT, WHERE and ORDER BY.
Step 4: Add statistics and data cleaning
Work on these alongside steps 2 and 3. You need descriptive statistics (mean, median, standard deviation, percentiles), a feel for outliers and skewed data, and the basics of correlation and A/B tests. Just as important is cleaning: real data has duplicates, blanks, typos and dates stored as text. Keep a cleaning log of every change you make; interviewers love asking how you handled messy data.
Step 5: Learn one BI tool and the rules of good charts
Build at least one dashboard in Power BI, Tableau or Looker Studio. Learn to choose the right chart (bars for comparisons, lines for trends), cut the clutter and write chart titles that state the takeaway, like "West drove half of Q1 revenue" instead of "Revenue by region."
Step 6: Build two or three portfolio projects
This is the step that gets you hired, and the one most people postpone. A portfolio project shows the whole workflow: a business question, the data, the cleaning, the analysis, a dashboard and a recommendation. Our portfolio project lesson walks you through a complete year-end sales review with a README template and a grading rubric. Ideas for more projects are in the next section.
Step 7: Package your work and apply
Publish your projects (GitHub, a dashboard link or a simple portfolio page), write a one-page résumé with bullet points that show results, and update your LinkedIn profile. Search beyond the exact title "data analyst": business intelligence (BI) analyst, reporting analyst, operations analyst and marketing analyst roles use the same skills. Expect a technical screen (often SQL), a case or take-home exercise and behavioral questions. We cover résumé bullets, interview stages and a 90-day job search plan in How to Get Your First Data Analyst Job.
Look for analysis work where you are. Automating a weekly report or building a small dashboard for your team gives you a real project, a result you can measure and sometimes a path to an internal analyst role.
Portfolio projects that get you interviews
A good project answers a question a business would pay to have answered. Use real public data or a realistic dataset, and make every project end with a recommendation. Here are five ideas that show different skills:
| Project | Business question | Skills it proves |
|---|---|---|
| Sales performance review | Which regions and products drive revenue, and where is margin slipping? | SUMIFS, pivot tables, SQL GROUP BY, a dashboard |
| Customer retention analysis | Which customers stop buying, and after how long? | SQL joins, cohort tables, line charts |
| Local open data story | Which neighborhoods wait longest for city service requests? | Cleaning messy public data, maps, clear storytelling |
| A/B test readout | Did the new checkout page really improve conversion? | Statistics, honest reporting of uncertainty |
| Personal or hobby dataset | What actually drives your spending, training or team results? | Curiosity, data collection, end-to-end ownership |
Before you publish a project, run it through this checklist:
Do you need a certification?
No, but one can help, especially if you have no degree or are changing careers. A certificate adds structure to your learning and keywords to your résumé. It doesn't replace a portfolio: hiring managers want to see what you can do with data. These are three well-known options:
- Format
- A series of online courses
- Level
- ●●●●
- Best for
- A structured start from zero.
- Format
- Proctored exam
- Level
- ●●●●
- Best for
- Proving Power BI skills for companies that use Microsoft tools.
- Format
- Proctored exam
- Level
- ●●●●
- Best for
- Showing broad data concepts, analysis and visualization knowledge.
Prices, exam formats and renewal rules change, so check each provider's official page before you commit. And if budget is tight, start free: our course ends with a certificate of completion you can add to LinkedIn next to your portfolio project.
How long does it take? A realistic timeline
It depends on where you start and how many hours you can study each week. These are planning estimates, not guarantees:
| Your starting point | Study time to be job-ready | Your biggest shortcut |
|---|---|---|
| Complete beginner, 8–10 hours a week | About 6–9 months | Follow one structured course instead of jumping between tutorials |
| You already use Excel at work | About 4–6 months | Turn a report you build at work into a portfolio project (with the data anonymized) |
| Graduate in business, economics or a STEM field | About 3–6 months | Polish a class project into a case study with a recommendation |
| Full-time study, 30+ hours a week | About 3–4 months | Start your first project in week 3, not at the end |
Here's how the roadmap fits into months for a beginner studying part-time:
- Months 1–2The process and spreadsheetsFormulas, lookups, pivot tables and charts on one practice dataset.
- Months 2–4SQL, plus statistics and cleaningDaily query practice; descriptive statistics and a cleaning log on the side.
- Month 5One BI toolBuild your first dashboard and learn the rules of good charts.
- Months 5–7Portfolio projectsTwo or three end-to-end projects, published with READMEs.
- Month 7 onwardRésumé, LinkedIn and applicationsStart applying while you finish your last project. Budget extra time for the search itself: applying, networking and interviewing is a project of its own.
Common mistakes to avoid
Collecting course certificates without building anything.
Start a real project by month 5. One finished, documented project beats five half-done courses.
Trying to learn Python, R, Tableau, Power BI and SQL at the same time.
One tool per category: a spreadsheet, SQL and one BI tool. Add Python later.
Portfolio projects that are just a pile of charts.
Start with a question and end with a recommendation someone could act on.
Skipping SQL because spreadsheets feel comfortable.
Learn SQL early. It's how analysts get data out of company databases.
Applying only to jobs titled "Data Analyst."
Also search BI, reporting, operations and marketing analyst roles.
Waiting until you feel 100% ready to apply.
If you match most of the required skills in a posting, apply.
Frequently asked questions
Can I become a data analyst without a degree?
Yes, it's possible. Some employers require a bachelor's degree and others accept equivalent skills or experience. Without a degree, your portfolio, a recognized certificate and analysis work at your current job carry even more weight, so invest in them early.
Is data analytics hard to learn?
The core tools are learnable without a technical background, and the math is mostly high school level plus a few statistics concepts. For many beginners the harder part is not the syntax but learning to ask sharp questions and explain findings clearly to non-technical people.
Do I need to know Python to become a data analyst?
Not to get started. Many entry-level postings list Python as "preferred" rather than required, while SQL and spreadsheets are expected. Learn SQL and one BI tool first, then add Python with pandas once you've finished your first project. When you get there, our free Python course starts from zero, and our free Power BI course covers the BI side.
How much do data analysts earn?
It varies a lot by city, industry and experience. The U.S. Bureau of Labor Statistics doesn't track "data analyst" as a single occupation; the first lesson of our free course summarizes the BLS pay and growth figures for the closest related occupations, such as data scientists and operations research analysts.
Should I learn Excel or SQL first?
Excel (or Google Sheets) first. You'll see the data change in front of you, which makes concepts like filtering, grouping and summarizing click. SQL then feels familiar: a GROUP BY query is a pivot table written in words.
Spreadsheets are where nearly every analyst starts, so start there too. Our guide to the 18 Excel formulas for data analysis shows each formula on the same small sales table, with the exact result.
Ready to start? Our free data analytics course takes you from your first formula to SQL, Power BI, Python and a portfolio project in 16 lessons, using one realistic sales dataset, with exercises and a certificate of completion.
Keep reading
 How to Make a Budget in 6 Steps (With Real Examples)
To make a budget, start with your monthly take-home pay, list everything you spend, sort …
 How to Improve Your Credit Score: 10 Steps That Work
The fastest ways to improve your credit score are to pay every bill on time, lower the sh…
 Debits and Credits Explained: Rules, Examples and Cheat Sheet
In accounting, a debit is an entry on the left side of an account and a credit is an entr…